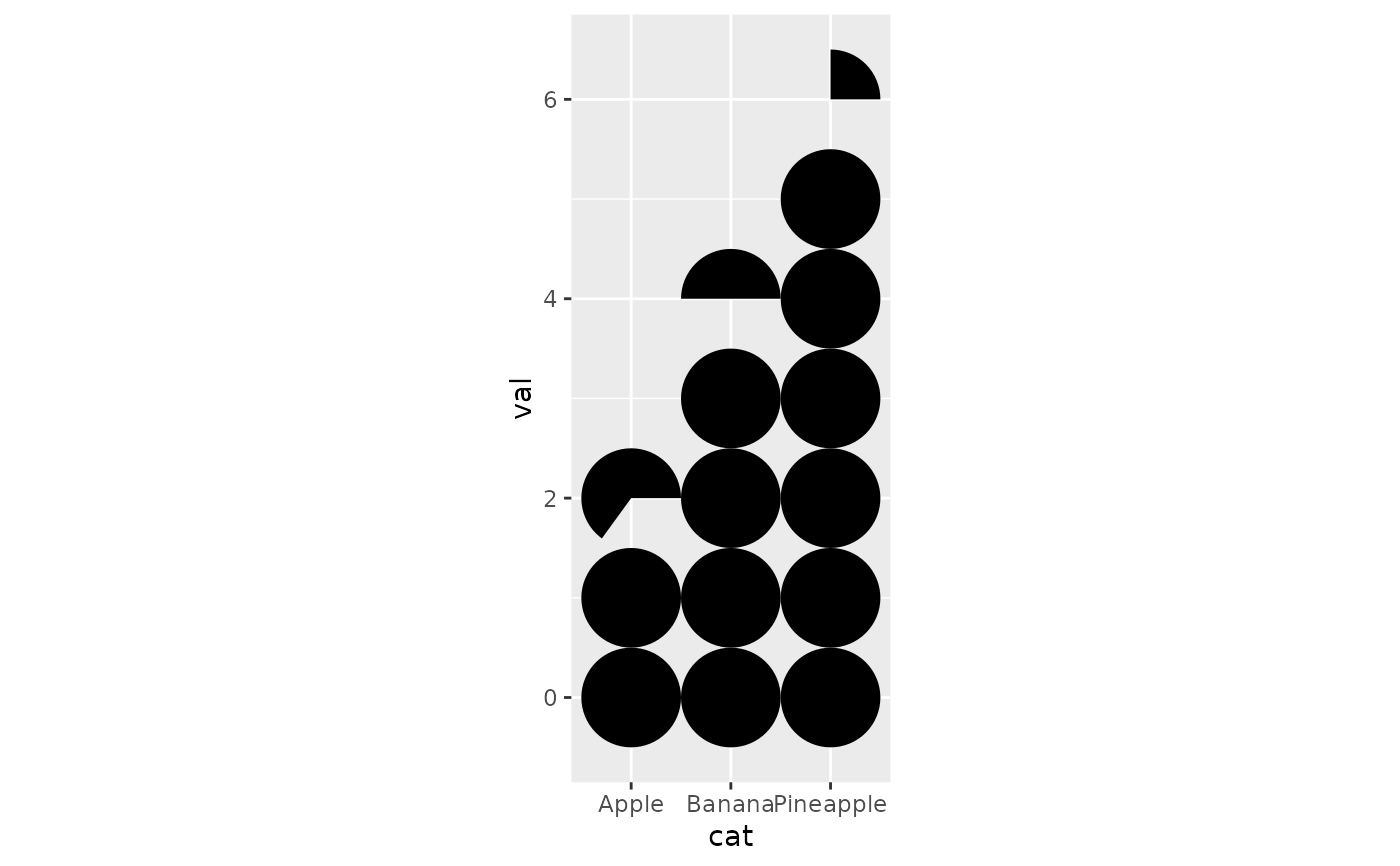
geom_series_circles() can be used as an alternative for
single or multiple bar charts. It consists of using
whole and fragments of circles to represent numerical values.
As it draws circles, the geom should use with ggplot2::coord_equal()
to maintain the "aspect ratio".
There are two are arguments absolutely needed in aes() mappings:
xA vector mapping the abscissa axisx, i.e. a character vector whenxis a numerical vector, or a numerical vector whenyis a character vector.yA vector mapping the ordinate axisy, i.e. a numerical vector whenxis a character vector or vice versa. There is a default mappingfillwith valueblackto fill circles/fragments of circles with. It can be used inaesmapping or as a global argument for all the circles.
Usage
geom_series_circles(
  mapping = NULL,
  data = NULL,
  show.legend = NA,
  na.rm = FALSE,
  inherit.aes = TRUE,
  init_angle = 0,
  r = 0.5,
  color = NA,
  linewidth = 0.5,
  ...
)
Arguments
- mapping
Set of aesthetic mappings created by
aes()oraes_(). If specified andinherit.aes = TRUE(the default), it is combined with the default mapping at the top level of the plot. You must supplymappingif there is no plot mapping.- data
to be displayed in this layer
- show.legend
logical. Should this layer be included in the legends?
NA, the default, includes if any aesthetics are mapped.FALSEnever includes, andTRUEalways includes. It can also be a named logical vector to finely select the aesthetics to display.- na.rm
If
FALSE, the default, missing values are removed with a warning. IfTRUE, missing values are silently removed.- inherit.aes
If
FALSE, overrides the default aesthetics, rather than combining with them.- init_angle
Circle drawing starting angle.
- r
Circle radius, should be <= 0.5.
- color
Color of circles/fragments of circles borders.
- linewidth
Size of circles/fragments of circles borders.
- ...
other arguments passed on to
layer().
Examples
my_df <- data.frame(cat = c("Apple", "Banana", "Pineapple"), val = c(2.65, 4.5, 6.25))
my_df |>
  ggplot2::ggplot() +
  geom_series_circles(ggplot2::aes(cat, val)) +
  ggplot2::coord_equal()